The complex and high-dimensional nature of medical images makes them difficult to incorporate into traditional linear model-based statistical analysis. One way of simplifying analysis of medical images is to use a dimensionality reduction technique. We designed a dimensionality reduction technique called “eigenanatomy” that performs dimensionality reduction while still maintaining an interpretable representation of brain structure. Read more here.
Sparse Regression for Medical Images
Our paper on sparse regression for predicting cognitive performance from cortical thickness was published at Information Processing in Medical Imaging (IPMI) 2013. We developed a method for performing regression on brain images in a way that respects the natural structure of the images and is suited to the extremely high dimensionality of medical images. Read the whole paper here.
ANTsR
We have been developing a framework to incorporate ITK and ANTs-based image processing methods into the R programming language to allow for interactive statistical analysis of medical images. R provides the most complete and current selection of statistical tools, including thousands of user-contributed packages. In addition, R provides an ideal platform for generating reproducible research, which has emerged as a topic of primary concern for scientists from a variety of disciplines. Check it out at http://stnava.github.io/ANTsR/.
Anterior and Posterior MTL networks in Aging and MCI
Our paper looking at dissociable functional networks of anterior and posterior MTL regions in older healthy controls and MCI patients just got accepted for publication in Neurobiology of Aging. We labeled MTL subregions in high-resolution T2-MRI using our automated MTL subregion labeling technique (implemented in the publicly available ASHS software). We used seed regions in entorhinal and perirhinal cortices and hippocampal head to define the anterior MTL network and parahippocampal cortex and hippocampal tail to define the posterior MTL network, using resting-state BOLD fMRI. The networks turned out to be largely dissociable, as has been shown in young adults previously. Notably, it’s not just the posterior network, commonly thought to be affected in Alzheimer’s Disease, that showed reduced connectivity in MCI, but the anterior network also showed disconnection. Further, cortical thickness within both networks were reduced in MCI. This project is a collaboration with David Wolk at the Penn Memory Center.
Segmentation of the aortic leaflets in 3D echocardiographic images
Given the importance of image-based morphological assessment in the diagnosis and surgical treatment of aortic valve disease, there is considerable need to develop a standardized framework for 3D valve segmentation and shape representation. Towards this goal, this work integrates template-based medial modeling and multi-atlas label fusion techniques to automatically delineate and quantitatively describe aortic leaflet geometry in 3D echocardiographic images, a challenging task that has been explored only to a limited extent. The method makes use of expert knowledge of aortic leaflet image appearance, generates segmentations with consistent topology, and establishes a shape-based coordinate system on the aortic leaflets that enables standardized automated measurements.
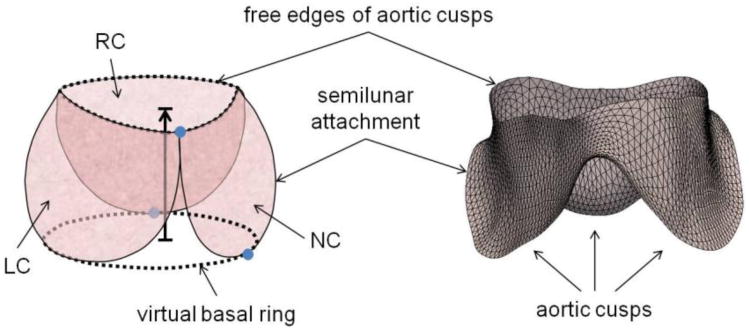
(Left) Schematic of the aortic cusps at systole. The valve orifice is the area enclosed by the cusp free edges, and the virtual basal ring connects the basal attachments of the cusps. Valve height is the distance between the virtual basal ring and valve orifice, shown by the black arrow pointing in the direction of blood flow. Three manually identified landmarks are shown in blue. (Right) The triangulated medial template of the aortic cusps used to initialize deformable modeling. (RC = right coronary cusp, LC = left coronary cusp, NC = noncoronary cusp)

A manual segmentation, consensus segmentation generated by label fusion, and fitted medial model of the aortic leaflets. The model-based segmentation is shown in red (right). The yellow arrow points in the direction of blood flow. (LC, RC, NC = left, right, and non-coronary cusps)
The development of this automated technique is a step towards creating a practical, informative tool for preoperative assessment of patient-specific aortic valve morphology.
Coming soon…
Segmentation of the complete aortic valve apparatus (cusps and root) with branching medial models.
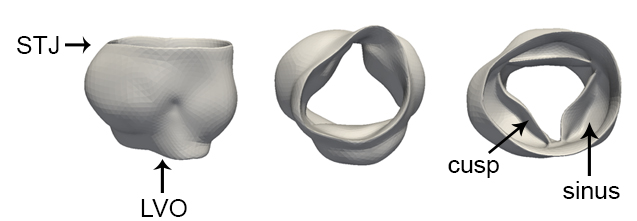
Aortic valve complex shown from three viewpoints: side (left), ventricular (center), and aortic (right) perspectives. (STJ = sinotubular junction, LVO = left ventricular outflow)
Statistical analysis of normal mitral annular geometry
The basis of mitral annuloplasty ring design has progressed from qualitative surgical intuition to experimental and theoretical analysis of annular geometry with quantitative imaging techniques. In this work, we present an automated 3D echocardiographic image analysis method that can be used to statistically assess variability in normal mitral annular geometry to support advancement in annuloplasty ring design.
3D patient-specific models of the mitral annulus are automatically generated from 3D echocardiographic images acquired from subjects with normal mitral valve structure and function. A mean 3D annular contour is computed, and principal component analysis is used to evaluate variability in normal annular shape.
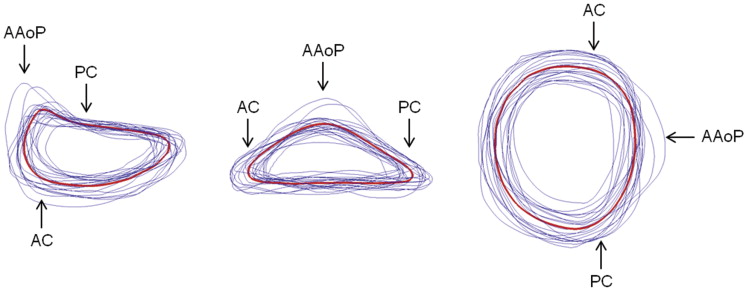
Mean (red) and individual (blue) 3D image-derived annular contours shown from three perspectives. (AAoP = anterior aortic peak; AC = anterior commissure; PC = posterior commissure.)
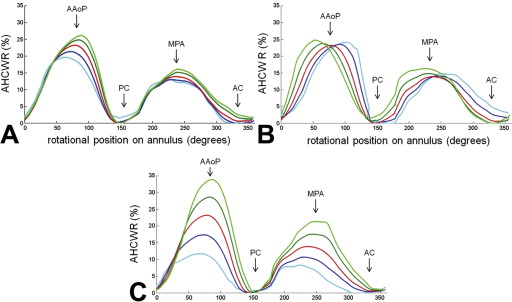
Annular height to intercommissural width ratio (AHCWR) as a function of rotational position on the annular contour. Each plot refers to one of three eigenmodes (A, mode 1; B, mode 2; C, mode 3) in shape variation obtained by principal component analysis. The red curve refers to the mean annular contour, the dark and light blue curves refer to +1 and +2 standard deviations from the mean, and the dark and light green curves refer to −1 and −2 standard deviations from the mean along a given eigenmode of shape variation. (AAoP = anterior aortic peak; AC = anterior commissure; MPA = midpoint of the posterior annulus; PC = posterior commissure.)
It is possible that a wider application of this analysis could provide information for a new generation of annuloplasty ring designs. All current designs are manufactured in a range of sizes with all sizes maintaining the same shape. With further study it may become apparent that to completely restore normal valve geometry, the next generation of saddle-shaped annuloplasty devices would best be created with subtle variations in shape as ring size increases.
Prediction of stress distributions on image-derived models of the mitral leaflets
An integrated methodology for imaging, segmenting, modeling, and deriving computationally-predicted pressure-derived mitral leaflet stresses is presented and points the way towards intraoperative and periprocedural guidance from morphometric and stress modeling of the mitral valve.
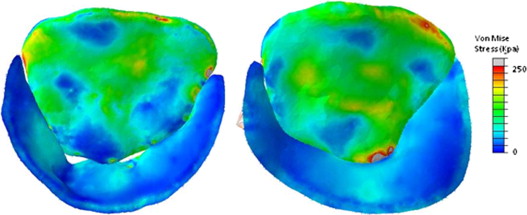
In vivo human mitral valves are imaged using real-time 3D transesophageal echocardiography, and volumetric images of the valve at mid systole are analyzed by user-initialized segmentation and 3D deformable modeling with continuous medial representation (cm-rep). The resulting models are loaded with physiologic pressures using finite element analysis. We present the regional leaflet stress distributions predicted in normal and diseased (regurgitant) mitral valves.
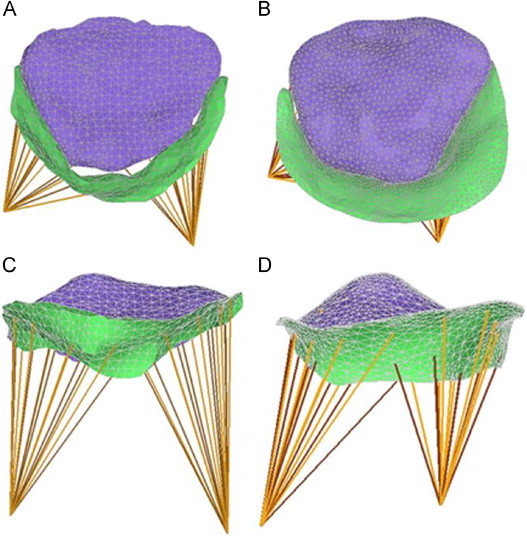
Finite element models of mid systolic diseased (A, C) and normal (B, D) mitral valves reconstructed from rt-3DTEE, in transvalvular (A, B) and oblique (C,D) views.
The ability to assess leaflet and chordal stresses in repaired valves will, with clinical experience, likely lead to improved surgical results by identifying patients with high stress valves in the early post-operative period. Such patients could either have re-repair or valve replacement before ever leaving the operating room, or could be subjected to closer post-operative clinical follow-up.
Fully automated segmentation of the mitral leaflets using multi-atlas label fusion and deformable medial modeling
Comprehensive visual and quantitative analysis of in vivo human mitral valve morphology is central to the diagnosis and surgical treatment of mitral valve disease. Real-time 3D transesophageal echocardiography (3D TEE) is a practical, highly informative imaging modality for examining the mitral valve in a clinical setting. To facilitate visual and quantitative 3D TEE image analysis, we describe a fully automated method for segmenting the mitral leaflets in 3D TEE image data. The algorithm integrates complementary probabilistic segmentation and shape modeling techniques:
- multi-atlas joint label fusion, and
- deformable modeling with continuous medial representation
to automatically generate 3D geometric models of the mitral leaflets from 3D TEE image data. These models are unique in that they establish a shape-based coordinate system on the valves of different subjects and represent the leaflets volumetrically, as structures with locally varying thickness. Without any user interaction, the method accurately captures patient-specific leaflet geometry at both systole and diastole in 3D TEE data acquired from a mixed population of subjects with normal valve morphology and mitral valve disease.
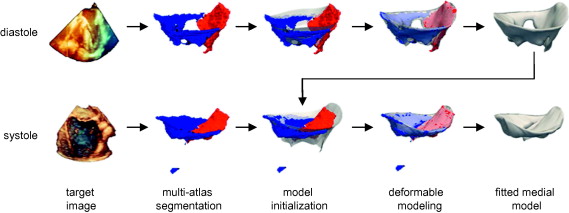
Automatic segmentation of the mitral leaflets at diastole (top row) and systole (bottom row) for a given patient. First, a probabilistic segmentation is generated by multi-atlas label fusion (red = anterior leaflet, blue = posterior leaflet). Then the cm-rep template (translucent) is initialized to the multi-atlas segmentation and the template is deformed to obtain a medial model of the mitral leaflets. The fitted diastolic model is used to initialize model fitting of the same subject’s valve at systole.
Semi-automated segmentation of the mitral leafelts in 3D echocardiographic images
Precise 3D modeling of the mitral valve has the potential to improve our understanding of valve morphology, particularly in the setting of mitral regurgitation (MR). Toward this goal, we have developed a user-initialized algorithm for reconstructing valve geometry from transesophageal 3D echocardiographic (3DE) image data.
Image analysis of the mitral valve at mid systole has two stages:
- user-initialized level sets segmentation
- 3D deformable modeling with continuous medial representation (cm-rep).
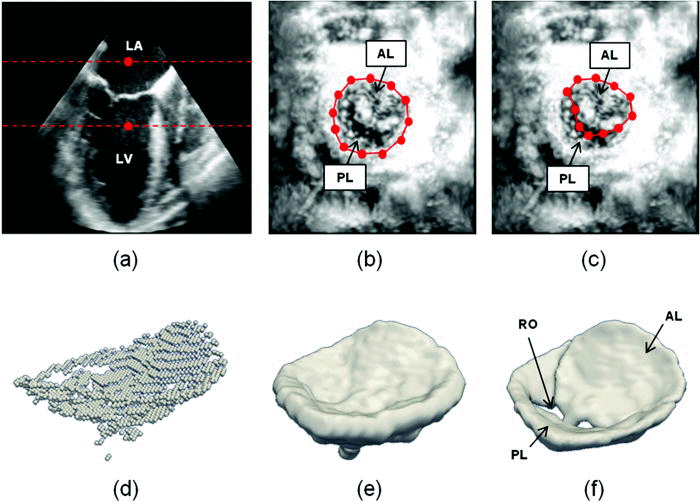
Semi-automated segmentation begins with user identification of valve location in 2D projection images generated from 3D US data. The mitral leaflets are then automatically segmented in 3D using the level set method.
- (a) The user initializes two points in a long-axis cross-section of the 3DE image volume, identifying an ROI (red) containing the valve along the axial dimension. (b) The user initializes a series of annular points in an enhanced projection image depicting the valve from an atrial perspective. (c) The user shifts posterior annular points into the coaptation zone, forming an outline of the anterior leaflet in the enhanced projection image. (d) A 3D point cloud delineating the valve is automatically generated. (e) The 3D point cloud is morphologically dilated with a spherical structuring element to obtain an ROI containing the valve. (f) A final segmentation of the valve is obtained by thresholding and active contour evolution. (LA=left atrium, LV=left ventricle, AL=anterior leaflet, PL=posterior leaflet, RO=regurgitant orifice).
Second, a bileaflet deformable medial model is fitted to the mitral leaflet segmentation by Bayesian optimization. The resulting cm-rep provides a visual reconstruction of the mitral valve, from which localized measurements of valve morphology are automatically derived.
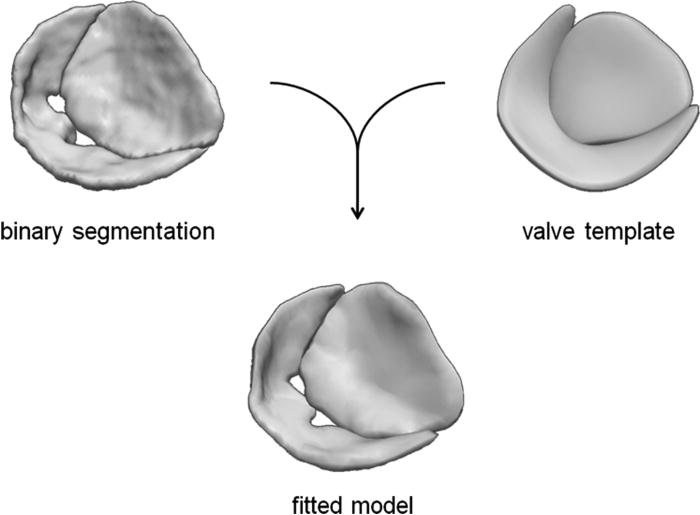
A medial representation of the valve is obtained by fitting a cm-rep template to a binary segmentation of the mitral leaflets.
Features such as anatomic regurgitant orifice area can be both visually observed and quantified from image-derived cm-reps of the mitral leaflets.

Automated reconstructions of the valves of six patients with various degrees of mitral regurgitation severity as shown from two viewpoints (atrial and lateral perspectives).
Feature Selection for Characterization of ILD and COPD

To compare the performance of various image-based metrics computed from thoracic HRCT modality with data from pulmonary function testing (PFT) in characterizing interstitial lung disease (ILD) and chronic obstructive pulmonary disease (COPD).
14 patients with ILD and 11 with COPD had undergone both PFT and HRCT within 3 days. For each patient, 93 image-based metrics were computed and their relationship with the 21 clinically-used PFT parameters were analyzed using a minimal-redundancy-maximal-relevance (MRMR) statistical framework. The first 20 features were selected out of the total 114 mixed image metrics and PFT values in characterization ILD and COPD.
Among the best performing 20 features, 14 were image metrics, derived from attenuation histograms and texture descriptions. The highest relevance value computed from PFT parameters was 0.47 and the highest from image metrics was 0.52, given the theoretical bound as [0, 0.69]. The ILD/COPD classifier using the first 4 features achieved a 1.92% error rate.

Conclusion Some image metrics are not only as good discriminators as PFT for characterization of ILD and COPD, but also not redundant when PFT values are provided. Image metrics of attenuation histogram statistics and texture descriptions may be valuable for further investigation in computer-assisted diagnosis.
