We designed a method to construct structural cortical graphs in a manner similar to BOLD-based functional connectivity graphs (paper, poster at MICCAI 2014).
Relating brain anatomy and cognitive ability using a multivariate multimodal framework
Linking structural neuroimaging data from multiple modalities to cognitive performance is an important challenge for cognitive neuroscience. In this study we examined the relationship between verbal fluency performance and neuroanatomy in 54 patients with frontotemporal degeneration (FTD) and 15 age-matched controls, all of whom had T1- and diffusion-weighted imaging.
Our goal was to incorporate measures of both gray matter (voxel-based cortical thickness) and white matter (fractional anisotropy) into a single statistical model that relates to behavioral performance. We first used eigenanatomy to define data-driven regions of interest (DD-ROIs) for both gray matter and white matter. Eigenanatomy is a multivariate dimensionality reduction approach that identifies spatially smooth, unsigned principal components that explain the maximal amount of variance across subjects. We then used a statistical model selection procedure to see which of these DD-ROIs best modeled performance on verbal fluency tasks hypothesized to rely on distinct components of a large-scale neural network that support language: category fluency requires a semantic-guided search and is hypothesized to rely primarily on temporal cortices that support lexical-semantic representations; letter-guided fluency requires a strategic mental search and is hypothesized to require executive resources to support a more demanding search process, which depends on prefrontal cortex in addition to temporal network components that support lexical representations.
We observed that both types of verbal fluency performance are best described by a network that includes a combination of gray matter and white matter. For category fluency, the identified regions included bilateral temporal cortex and a white matter region including left inferior longitudinal fasciculus and frontal–occipital fasciculus. For letter fluency, a left temporal lobe region was also selected, and also regions of frontal cortex. These results are consistent with our hypothesized neuroanatomical models of language processing and its breakdown in FTD. We conclude that clustering the data with eigenanatomy before performing linear regression is a promising tool for multimodal data analysis.

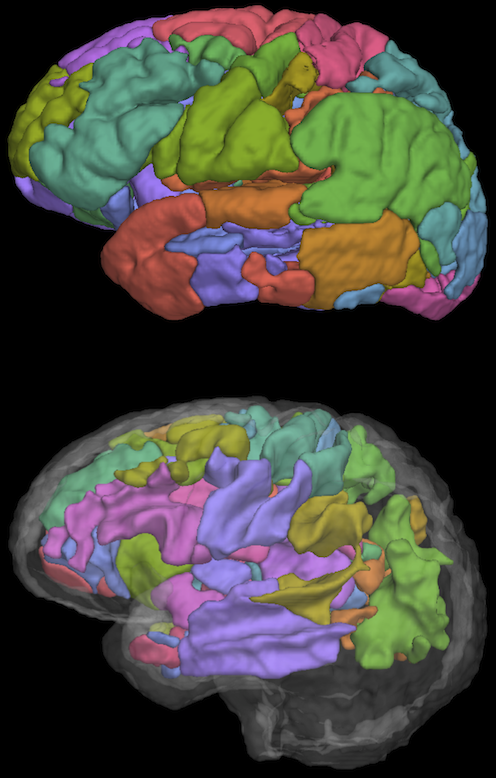
Thresholded soft ROIs generated from the Eigenanatomy decomposition of the cortical thickness (top) and fractional anisotropy (bottom) data based on sparse PCA. A total of 32 regions were generated for each modality.
This work is currently in press atNeuroImage, and is a collaboration between PICSL, the Penn FTD Center and the Peelle Lab at Washington University in St Louis.
Eigenanatomy is available as part of ANTs.
Update: the paper is now published and is available free until August 21 2014:
http://www.sciencedirect.com/science/article/pii/S1053811914003735
Reproducibility of graph metrics of human brain structural networks
Recent interest in human brain connectivity has led to the application of graph theoretical analysis to human brain structural networks, in particular white matter connectivity inferred from diffusion imaging and fiber tractography. While these methods have been used to study a variety of patient populations, there has been less examination of the reproducibility of these methods. A number of tractography algorithms exist and many of these are known to be sensitive to user-selected parameters. The methods used to derive a connectivity matrix from fiber tractography output may also influence the resulting graph metrics. Here we examine how these algorithm and parameter choices influence the reproducibility of proposed graph metrics on a publicly available test-retest dataset consisting of 21 healthy adults. The dice coefficient is used to examine topological similarity of constant density subgraphs both within and between subjects. Seven graph metrics are examined here: mean clustering coefficient, characteristic path length, largest connected component size, assortativity, global efficiency, local efficiency, and rich club coefficient. The reproducibility of these network summary measures is examined using the intraclass correlation coefficient (ICC). Graph curves are created by treating the graph metrics as functions of a parameter such as graph density. Functional data analysis techniques are used to examine differences in graph measures that result from the choice of fiber tracking algorithm. The graph metrics consistently showed good levels of reproducibility as measured with ICC, with the exception of some instability at low graph density levels. The global and local efficiency measures were the most robust to the choice of fiber tracking algorithm.

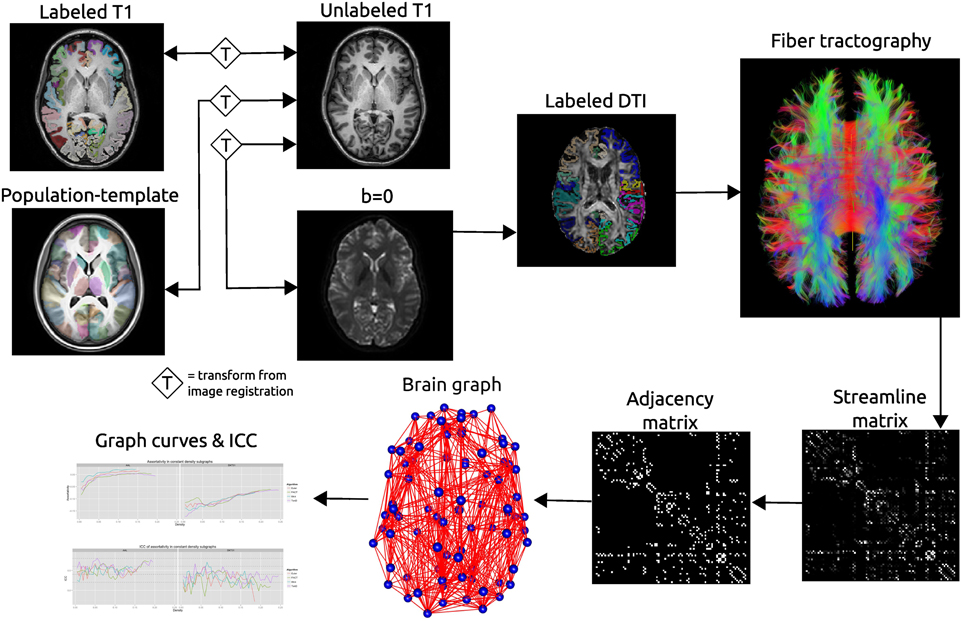
Schematic of the network processing scheme. Image registration is used to find transformations between the T1 image and: the T1 image for that subject’s other time point; the population template; the b = 0 image acquired as part of the DTI acquisition. Labels are transformed into the DTI space where fiber tractography is performed. A matrix is created that records the number of streamline connecting each pair of labeled regions. This matrix is thresholded as constant density to create an adjacency matrix which defines connections in a brain graph. Graph curves are generate by calculating network summary measures over a range of density values and ICC plots are used to examine the reproducibility of the metrics.
*New* ANTs Documentation
To go along with a new release:
http://stnava.github.io/ANTsDoc/
Please contribute to this latex document or make suggestions for its content.
Polyaffine transformation model using region trajectory
We propose a novel way to construct a diffeomorphic polyaffine transformation model. Each affine transform is defined on a local region and the resulting diffeomorphism encapsulates all the local transforms by a smooth and invertible displacement field. Compared with traditional weighting schemes used in combining local transforms, our new scheme guarantees that the resulting transform precisely preserves the value of each local affine transform. By introducing the trajectory of local regions instead of using regions themselves, the new approach encodes precisely each local affine transform using a diffeomorphism with one or more stationary velocity fields.

Interactive Medical Image Registration
| Thin-Plate Spline | Bounded Biharmonic Function |

|

|
Regional Thickness Measurement of Extra-hippocampal Medial Temporal Lobe Structures
Extra-hippocampal medial temporal lobe (ehMTL) structures, which consists of entorhinal (ERC) and perirhinal (PRC) cortices, receives increasing attention because they are amongst the earliest sites affected by Alzheimer`s Disease (AD) pathology and due to their important and complex role in episodic memory. However, large anatomical variation in the medial temporal lobe (MTL) makes it a challenging area for analysis. In order to address this problem, we develop an automatic segmentation, clustering, and thickness measurement approach that explicitly accounts for anatomical variation in this region. Our proposed approach yields thickness measurements with greater statistical power in distinguishing Mile Cognitive Impairment (MCI) from normal control.
Controllability on Brain Networks

Postmortem, probabilistic atlas of the human hippocampal formation
We are constructing a computational, probabilistic atlas of the human hippocampal formation (HF) from postmortem, high-resolution 9.4T MRI and densely acquired histology.
The human HF consists of several structures of the medial temporal lobe that play important roles in the declarative memory system. The HF is divided into cytoarchitecturally-defined subfields that serve different roles in the memory system and that are differentially affected by the processes of aging and neurological and psychiatric disorders.
MRI is the primary tool for biomarker discovery in the HF, since it is sensitive to small changes in shape/volume and robust to repeat measures over time. However, the HF substructures have complex anatomical structures that cannot be fully distinguished on routine in vivo MRI.
The atlas template image is being generated by normalizing postmortem MRI of multiple whole-HF tissue samples in a diffeomorphic registration framework. Histology, reconstructed in 3D from a subset of these samples, serves as the primary source for labeling structures in the atlas, including the subfields. When complete, our atlas will serve important roles in the hippocampal imaging field:
- Prior model for automatic in vivo MRI segmentation
- Guide development of manual MRI segmentation protocols
- Reference space for anatomical and functional imaging studies
- Anatomy learning resource
Image Acquisition Protocol
We acquire postmortem 3D MRI at 9.4T (~0.2mm isotropic) using a spin-echo multi-slice sequence from all HF tissue samples:
A subset of the tissue samples is sectioned at 5μm thickness with 200μm spacing, stained using the Kluver-Barrera method (luxol fast blue + cresyl violet) for myelin and neuronal cell bodies, then digitally scanned at 0.5×0.5μm resolution.
Manual histology segmentation protocol
Subfields are manually segmented along the entire length of the HF in the histology slides. Boundaries between adjacent subfields are determined on the basis of cytoarchitectonic features (e.g. size, shape, and density of the neuronal somata), rather than using geometric or heuristic rules.
Histology slide and subfield label reconstructions
Histology images and labels are reconstructed in 3D and co-registered into the anatomical space of the matching postmortem MRI using a sequence of 2D and 3D affine and diffeomorphic registration steps:
For further details, please see our publication describing histology reconstruction in MRI space performed on one subject:

Hippocampal subfield labels derived from histology reconstructed in 3D after manual label refinement
This is the first work demonstrating hippocampal subfield labels in MRI space that are derived from ground-truth histological imaging. We are in the process of acquiring histology of more samples (normal and AD-affected cases) so that our atlas will capture variability of subfield distributions. We are also developing improved groupwise registration methodology for co-registering the MR images to create the atlas reference space.
We expect our postmortem atlas to serve as a valuable resource for future imaging studies by providing prior knowledge on the shapes and distributions of the subfields.
ANTs Perfusion Processing
We have recently updated ANTs to perform processing of perfusion ASL images. The pipeline is designed to be consistent with the antsCorticalThickness pipeline for computing cortical thickness and incorporates state-of-the-art methods for correcting for motion and other confounds. Learn more about the script here.

