We contribute a novel multivariate strategy for computing the structure of functional networks in the brain from arterial spin labeling (ASL) MRI. Our method fuses and correlates multiple functional signals by employing an interpretable dimensionality reduction method, sparse canonical correlation analysis (SCCA). There are two key aspects of this contribution. First, we show how SCCA may be used to compute a multivariate correlation between different regions of interest (ROI). In contrast to averaging the signal over the ROI, this approach exploits the full information within the ROI. Second, we show how SCCA may simultaneously exploit both the ASL-BOLD and ASL-based cerebral blood flow (CBF) time series to produce network measurements. Our approach to fusing multiple time signals in network studies improves reproducibility over standard approaches while retaining the interpretability afforded by the classic ROI region-averaging methods. We show experimentally in test-retest data that our sparse CCA method extracts biologically plausible and stable functional network structures from ASL. We compare the ROI approach to the CCA approach while using CBF measurements alone. We then compare these results to the joint BOLD-CBF networks in a reproducibility study and in a study of functional network structure in traumatic brain injury (TBI). Our results show that the SCCA approach provides significantly more reproducible results compared to region-averaging, and in TBI the SCCA approach reveals connectivity differences not seen with the region averaging approach.
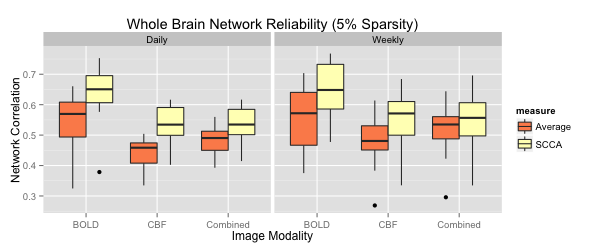
For each metric, using both region averaging (orange) and SCCA (yellow), connectivity matrices were calculated from ASL data acquired in separate acquisitions in the same day and for data acquired one week apart. Whole network correlations were then calculated to examine reliability for the daily (left) and weekly (right) data for each subject. Here we illustrate results using sparsity values of s=t=0.05. A range of sparsity values (s=t) up to 0.25 were examined and these higher values did not produce qualitatively different results.