This short 90-minute course was held at RSNA 2016 in Chicago on Nov 28 and Dec 1, 2016. The course offered a brief introduction to main manual and semi-automatic segmentation functionality in ITK-SNAP 3.6.
Videos, exercise handouts, and example data are available from the ITK-SNAP page.
Tau-PET imaging and subregional atrophy in medial temporal lobe
We recently examined potential relationship between tau protein uptake in medial temporal lobe (MTL) and volumetric measures of MTL subregions in a small dataset of Alzheimer’s disease patients. Since tau protein accumulates in MTL in a characteristic spatiotempoal pattern as described by Braak and Braak, which ultimately may result in neurodegeneration and volume loss, we expected to see a correlation between tau uptake measured using tau PET imaging, and volume measured from high-resolution structural MRI using ASHS. Indeed, we found that earliest region to receive tau pathology, BA35 which is part of perirhinal cortex, has a strong relationship between tau uptake and structural atrophy. These data were presented at AAIC 2016, and a manuscript is currently under review.
Short-term memory and medial temporal lobe
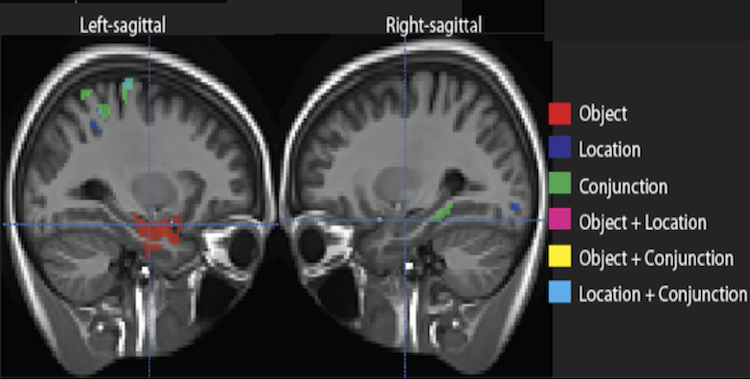
Medial temporal lobe (MTL) is generally thought to be a principal site of long term memory (LTM) process, and isn’t usually associated with short term memory (STM). Some recent work have suggested a role for MTL in STM when binding of different elements is required. This study looked at the association of MTL structures with STM performance in memory for objects, location, and most critically, a conjunction of both, in a population of mild cognitive impairment (MCI) patients. Patients performed worse than age-matched controls in all tasks. Further, cortical thickness in MTL substructures was dissociably correlated along the long axis of the MTL. The dissociable regions were largely similar to the anterior posterior MTL networks described in older adults and MCI in our previous work.
This work highlights the relatively unexplored role of MTL in STM, in line with the vast literature of its fundamental role in LTM. It also shows a similar division of labor with respect to different types of memory representations along the anterior-posteriors axis of MTL. This project is a collaboration with David Wolk at the Penn Memory Center.
Accounting for the Confound of Meninges in Segmenting Entorhinal and Perirhinal Cortices in T1-weighted MRI
Quantification of medial temporal lobe (MTL) cortices, including entorhinal cortex (ERC) and perirhinal cortex (PRC), from in vivo MRI is desirable for studying the human memory system as well as in early diagnosis and monitoring of Alzheimer’s disease. However, ERC and PRC are commonly over-segmented in T1-weighted MRI (T1w MRI) because of the adjacent meninges, which consist of three layers of membranes, including dura mater, arachnoid mater and pia mater, and envelop the brain and spinal cord.
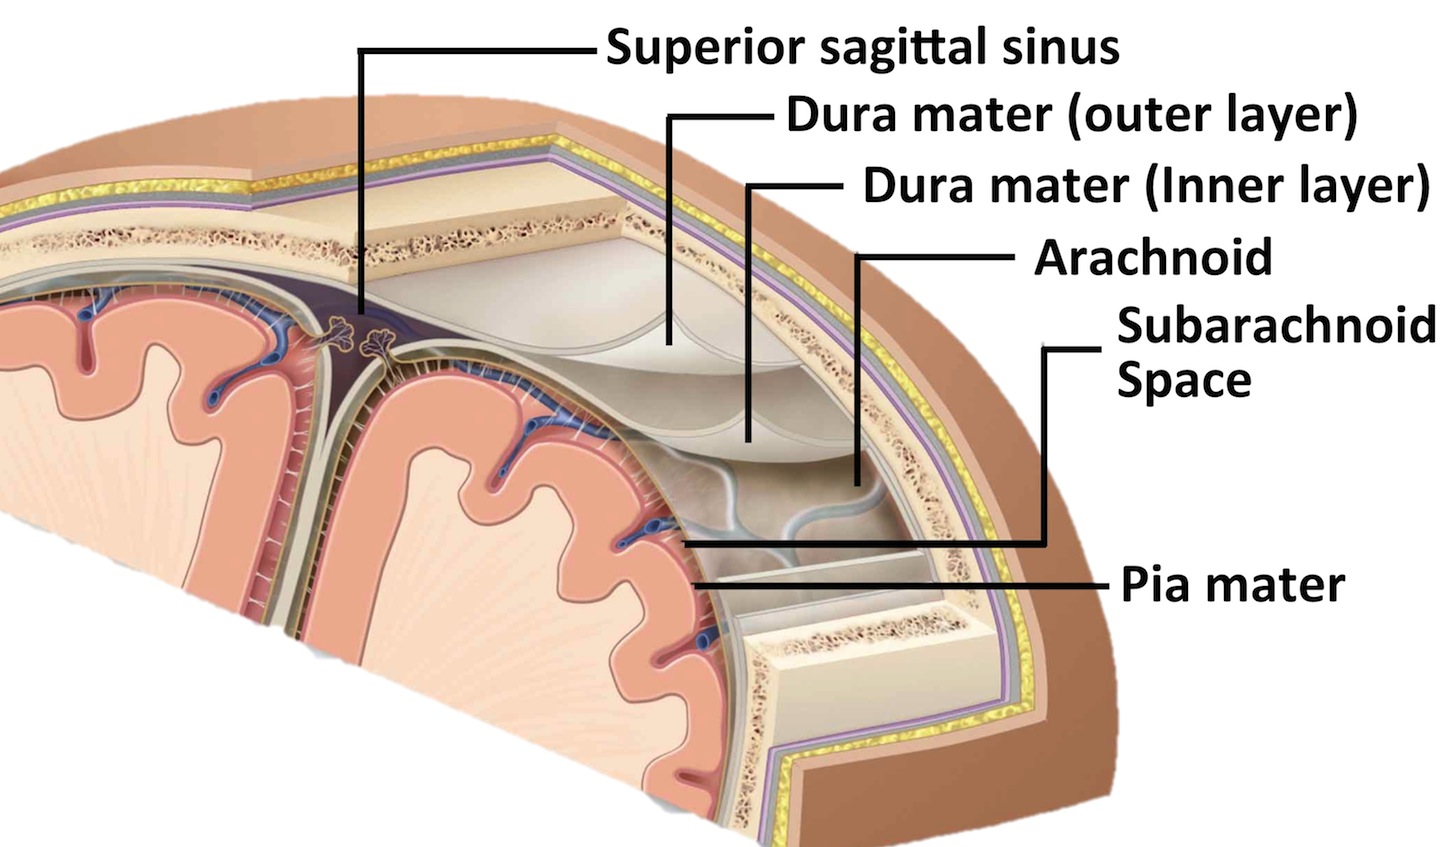
Figure 1. Meningeal Layers.
The dura mater has similar intensity to gray matter (GM) in T1 contrast (Figure 2a). By contrast, in T2w MRI, meninges are easy to separate from GM due to their dark appearance in T2 contrast (Figure 2b). The likely mislabeling of meninges as GM by intensity-based methods using T1w MRI would introduce errors to the quantification of ERC and PRC, potentially confounding the findings of research studies by generating incorrect measurements.
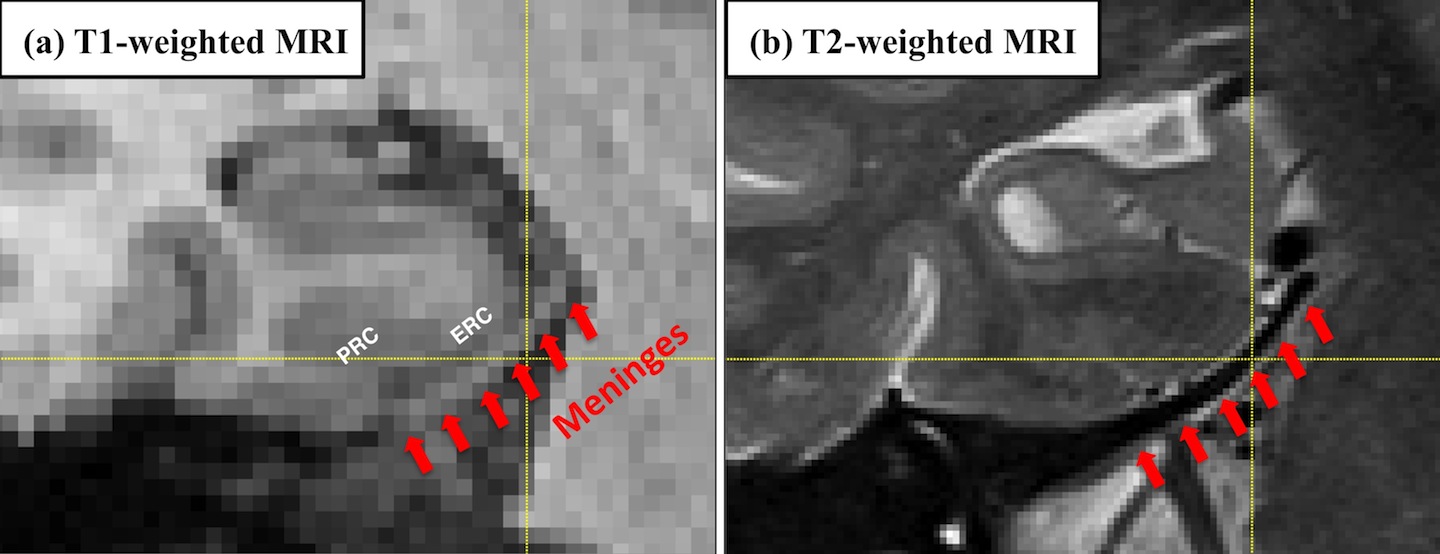
Figure 2. The appearance of meninges in T1-weighted and T2-weighted MRI.
To the best of our knowledge, none of the analysis pipelines for MTL cortices using T1w MRI have addressed this confound, and the dura mater are often segmented as part of the GM by the state-of-the-art image processing algorithms (ANTS [1], FreeSurfer [2], Figure 3)
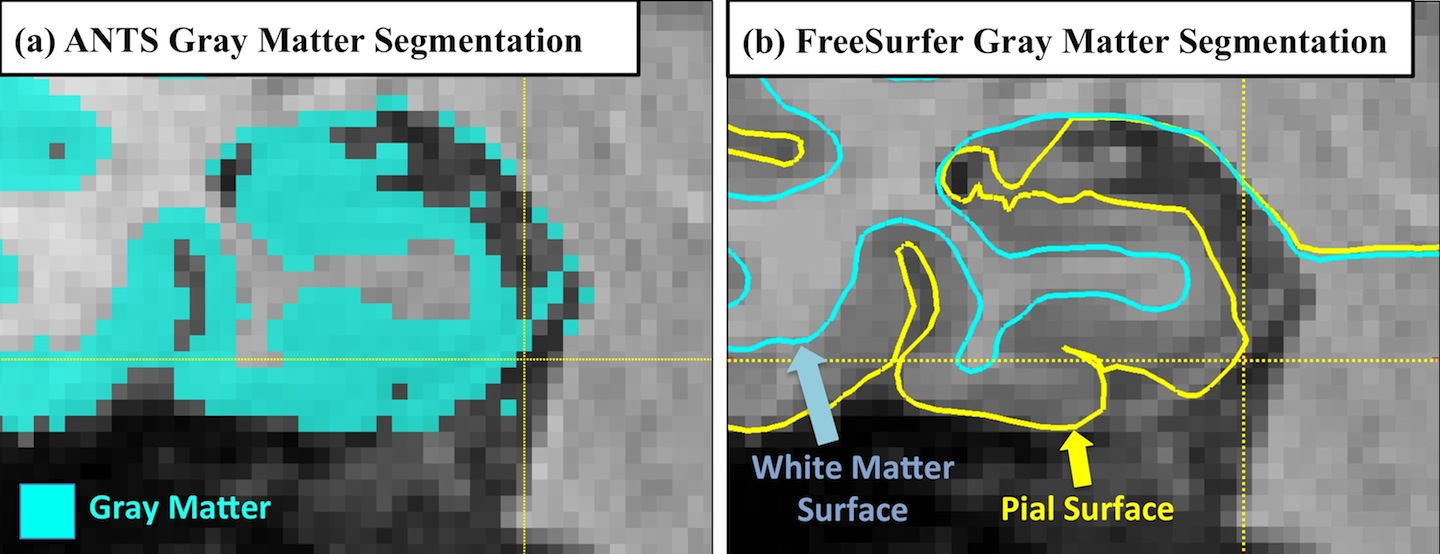
Figure 3. The meninges is often segmented as gray matter by the state-of-the-art image processing algorithms, including (a) ANTS and (b) FreeSurfer.
Recent work by Xie et al. presented at the 19th international conference on Medical Image Computing and Computer Assisted Intervention (MICCAI 2016) [3] proposed to segment MTL cortices along with the adjacent dura mater in T1w MRI using an established multi-atlas segmentation framework (ASHS [4]) together with super-resolution technique [5]. Experimental results comparing the proposed pipeline with existing pipelines support the notion that a large portion of meninges is segmented as gray matter by existing algorithms but not by our algorithm. Cross-validation experiments demonstrate promising segmentation accuracy. Further, agreement between the volume and thickness measures from the proposed pipeline and those from the manual segmentations increase dramatically as a result of accounting for the confound of meninges. Evaluated in the context of group discrimination between patients with amnestic mild cognitive impairment and normal controls, the proposed pipeline generates more biologically plausible results and improves the statistical power in discriminating groups in absolute terms comparing to other techniques using T1w MRI.
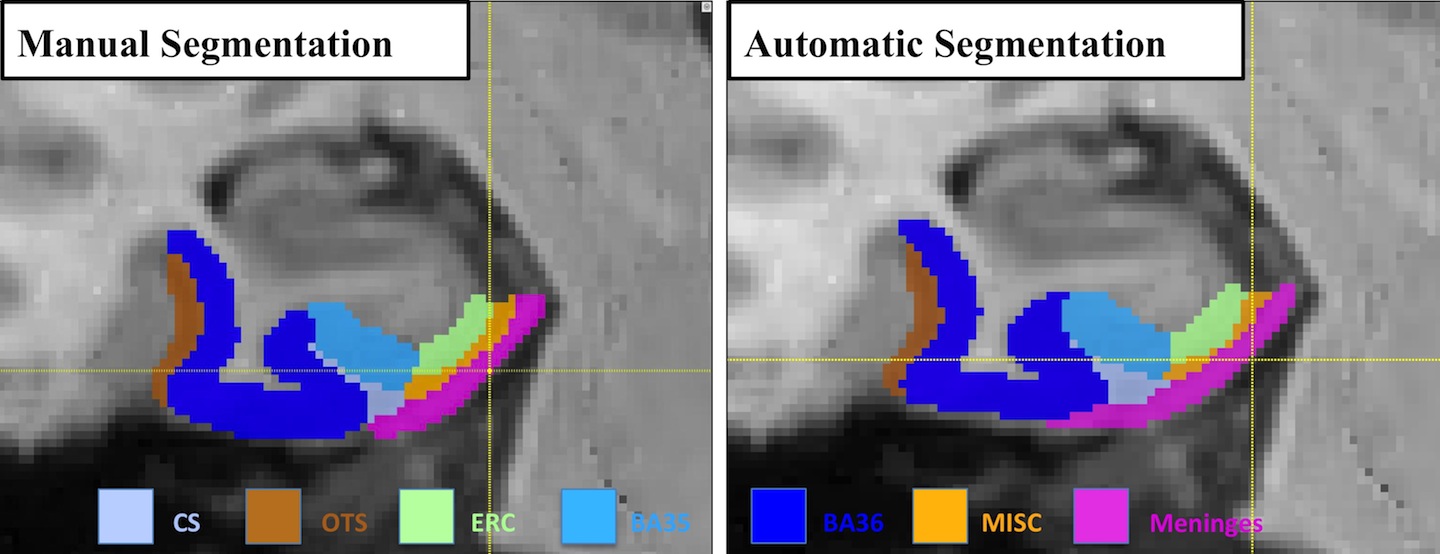
Figure 4. An example of manual and automatic segmentation.
Our evaluation also showed that the proposed pipeline using T1w MRI is not as reliable or accurate as T2-based segmentation of ERC and PRC, which could due to the poorer ability to resolve GM boundaries limited by low resolution and the confound of meninges in T1w MRI. This suggests that the T2-weighted MRI should be preferred for studies focused on these structures. However, T1w MRI is much more common in today’s neuroimaging studies, and the proposed approach makes it possible to generate ERC and PRC measures that are strongly consistent with T2-measures. Thus we expect it to have significant application in the analysis of retrospective and prospective brain imaging data, particularly in studies involving AD, aging, and memory.
References:
- [1] Das, S.R., Avants, B.B., Grossman, M., Gee, J.C. Registration based cortical thickness measurement. Neuroimage 2009. 45, 867–79.
- [2] Fischl B. FreeSurfer. Neuroimage 2012; 62: 774–81.
- [3] Xie, L., Wisse, E. M. L., Manjon, V. J. Wang, H., Das, S. R., Wolk, A. D., Yushkevich, A. P. Accounting for the Confound of Meninges in Segmenting Entorhinal and Perirhinal Cortices in T1-weighted MRI. In Medical Image Computing and Computer-Assisted Intervention–MICCAI 2016. Springer International Publishing.
- [4] Yushkevich PA, Pluta JB, Wang H, Xie L, Ding S, Gertje EC, et al. Automated volumetry and regional thickness analysis of hippocampal subfields and medial temporal cortical structures in mild cognitive impairment. Hum. Brain Mapp. 2015; 36: 258–287.
- [5] Manjón J V, Coupé P, Buades A, Collins LD, Robles M. MRI superresolution using self- similarity and image priors. Int. J. Biomed. Imaging 2010a; 2010: 425891.
Multi-Template Analysis of Human Perirhinal Cortex in Brain MRI: Explicitly Accounting for Anatomical Variability
The human perirhinal cortex (PRC) plays critical roles in episodic and semantic memory and visual perception. The PRC consists of Brodmann areas 35 and 36 (BA35, BA36). In Alzheimer’s disease (AD), BA35 is the first cortical site affected by neurofibrillary tangle pathology [1], which is closely linked to neural injury in AD. Large anatomical variability, manifested in the form of different cortical folding and branching patterns, makes it difficult to segment the PRC in MRI scans. Pathology studies [2] have found that in ~97% of specimens, the PRC falls into one of three discrete anatomical variants (Figure. 1).
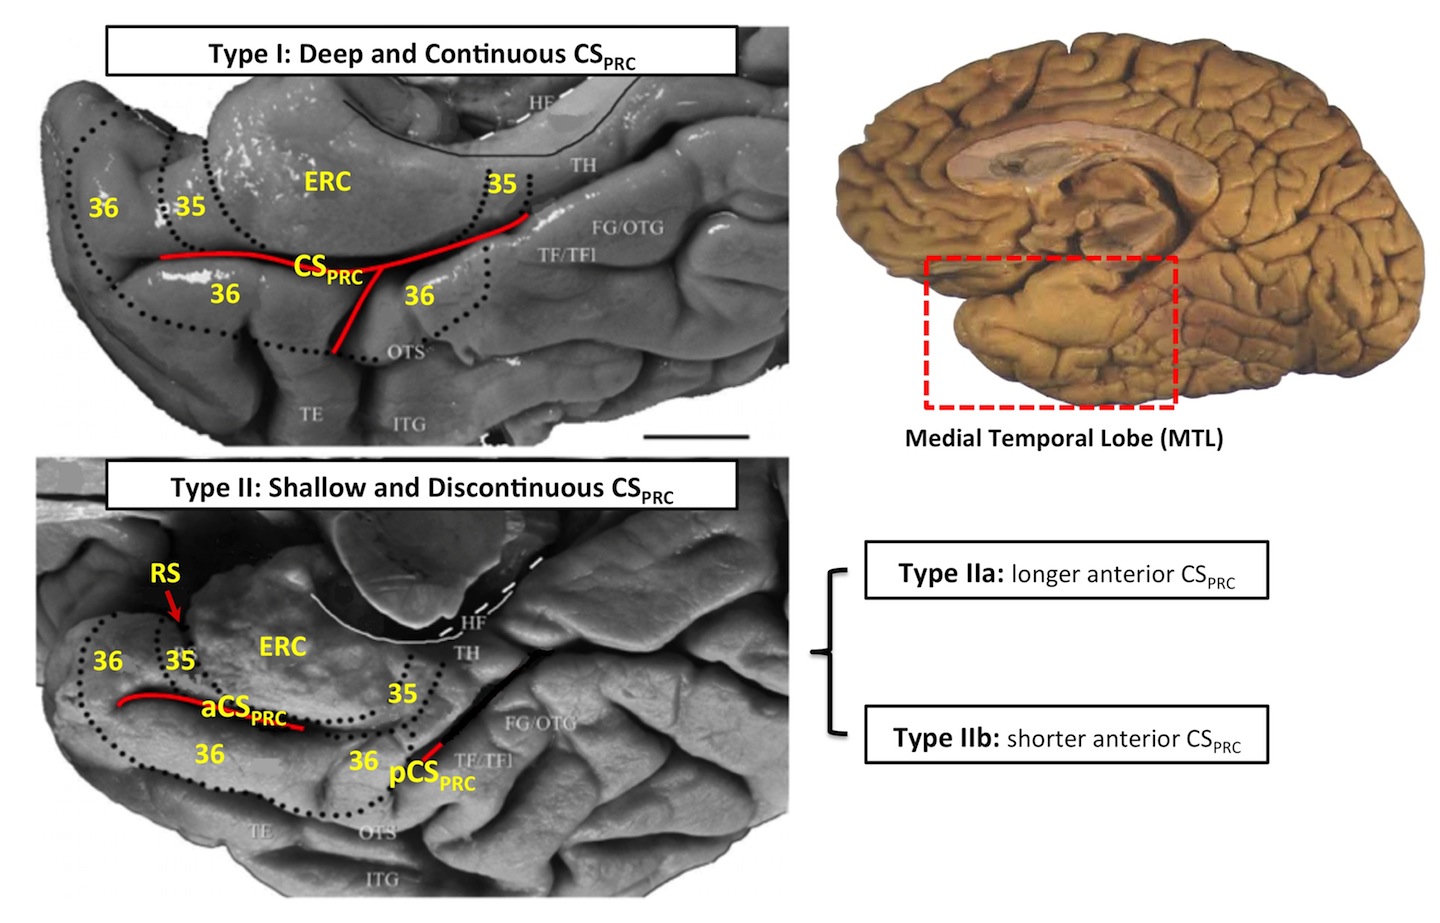
Figure 1. Three anatomical variants of the PRC defined by the folding and branching patterns of the collateral sulcus. Figure adapted from [2]. Abbreviations: ERC = entorhinal cortex; 35, 36 = Brodmann areas 35 and 36; BA35, BA36 = Brodmann areas 35 and 36; PRC = perirhinal cortex; CS = collateral sulcus; CSPRC = the portion of CS adjacent to PRC; aCSPRC/pCSPRC = anterior/posterior CSPRC; HF = hippocampal fissure; RS = rhinal sulcus; FG = fu- siform gyrus; HIPPO = Hippocampus; OTG = occipito-temporal gyrus; OTS = occipito-temporal sulcus; ITG = inferior temporal gyrus; TE, TH, TF = temporal areas TE, TH, TF defined; TFl = lateral subdivisions of area TF.
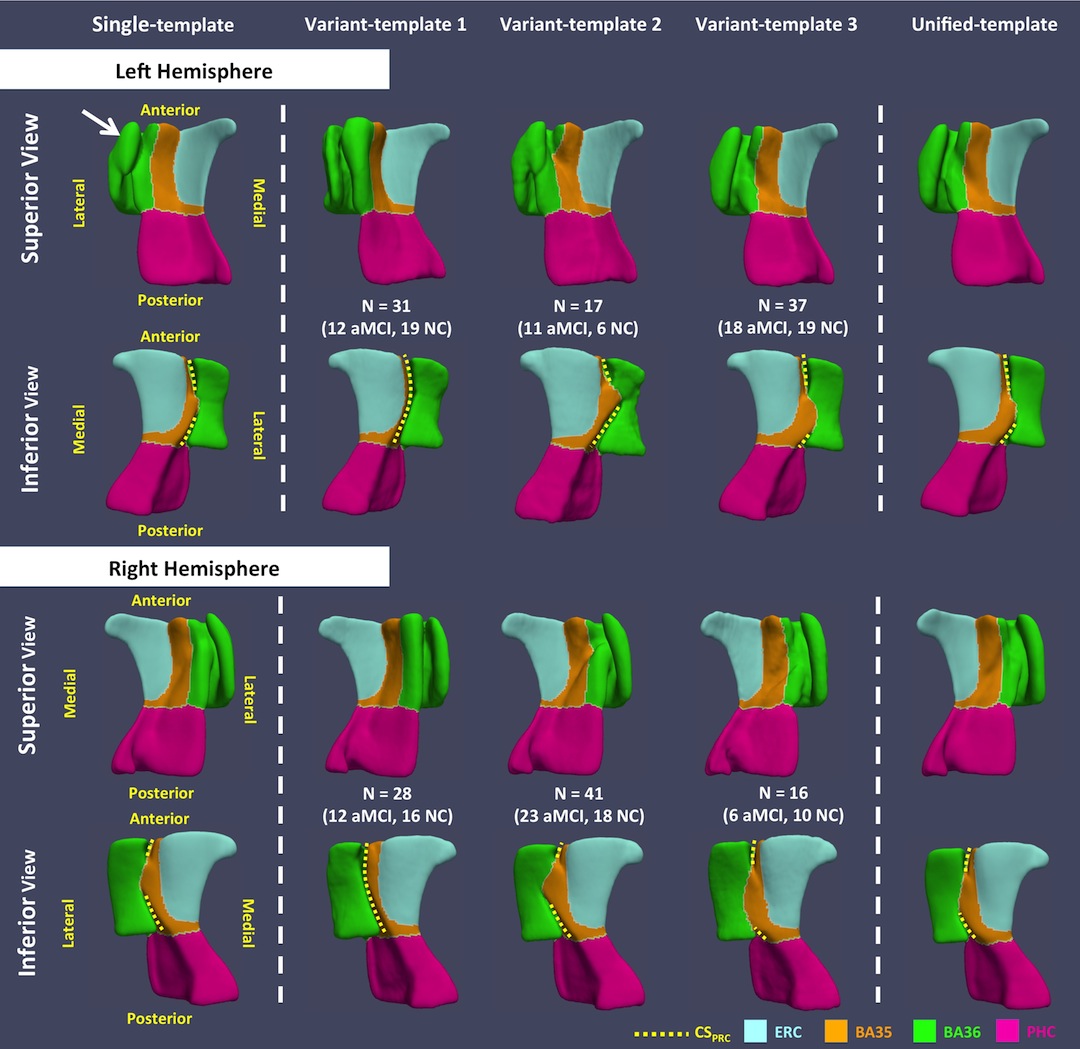
Figure 2. Template meshes obtained using the single-template (ST), variant-template (VT) and unified- template (UT) approaches for both hemispheres. The white arrow points to the structure that connects the medial and lateral borders of BA36 generated by the ST approach, which is anatomically implausible. Yellow dashed curves mark CSPRC in all templates. VT 1 resembles the continuous CSPRC variant. Discontinuous CSPRC is observed in VT 2 and VT 3, and these VTs differ, as expected, by the relative length of the anterior and posterior CSPRC (i.e. anterior CSPRC is shorter in VT 2 while it is longer in VT 3).
Further, when applied to a dataset of patients with amnestic mild cognitive impairment (a-MCI) and normal control, the multi-template approach yielded larger t-statistics in discriminating the two groups compared to the single-template approach, volumetric measurements based on multi-atlas segmentation, and thickness measures extracted from T1w MRI by FreeSurfer [5]. This method may have important utility in the diagnosis and monitoring of early AD, as well as for providing accurate measurements to enhance brain-behavior studies in the medial temporal lobe.
References:
- [1] Braak H, Braak E. Staging of Alzheimer’s disease-related neurofibrillary changes. Neurobiol. Aging 1995; 16: 271–278.
- [2] Ding S-L, Van Hoesen GW. Borders, extent, and topography of human perirhinal cortex as revealed using multiple modern neuroanatomical and pathological markers. Hum. Brain Mapp. 2010; 31: 1359–79.
- [3] Xie L, Pluta JB, Das SR, Wisse LE, Wang H, Mancuso L, Kliot D, Avants BB, Ding SL, Manjón JV, Wolk DA. Multi-Template Analysis of Human Perirhinal Cortex in Brain MRI: Explicitly Accounting for Anatomical Variability. NeuroImage. 2016 Oct 1.
- [4] Yushkevich PA, Pluta JB, Wang H, Xie L, Ding S, Gertje EC, et al. Automated volumetry and regional thickness analysis of hippocampal subfields and medial temporal cortical structures in mild cognitive impairment. Hum. Brain Mapp. 2015; 36: 258–287.
- [5] Fischl B. FreeSurfer. Neuroimage 2012; 62: 774–81.
Medial temporal lobe subregional morphometry using high resolution MRI in Alzheimer’s Disease
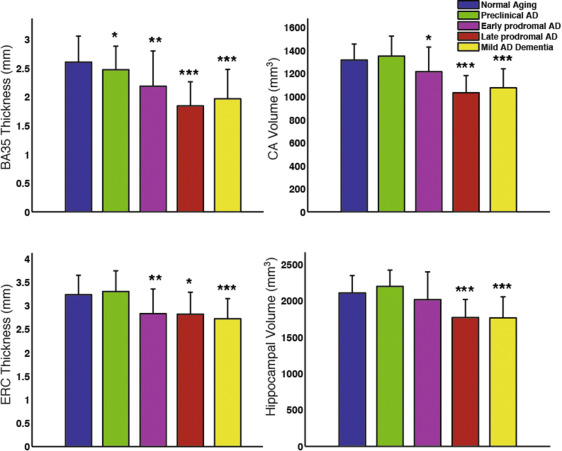
Group comparison of select MTL subregional measurements adjusted for age and ICV. Statistical significance is based on comparison with the “normal aging” group (amyloid-negative ADNI controls). Error bars reflect 1 standard deviation. *: p<0.05, **: p<0.01, ***:p<0.001.
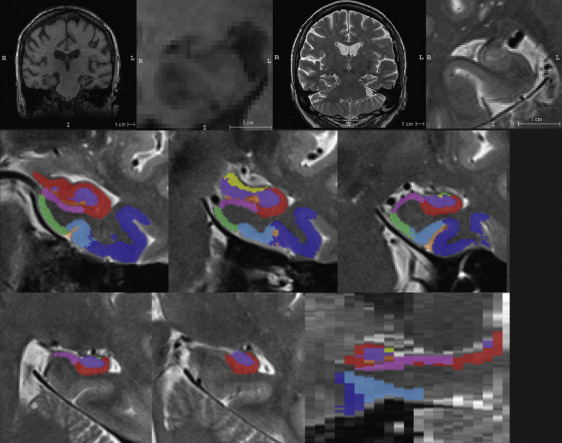
Top row from left to right: ADNI T1-MRI, T1-MRI zoomed in to hippocampus in coronal view, ADNI T2-MRI, zoomed in to hippocampus in oblique coronal view. Middle and bottom row show an example of automatic segmentation of MTL subregions using ASHS.
Recently published paper by Wolk et al. in Neurobiology of Aging examines the involvement of hippocampal subfields and medial temporal lobe (MTL) cortical subregions in different stages of Alzheimer’s disease (AD). The study used high-resolution T2-weighted MRI scans of the hippocampal region from the Alzheimer’s Disease Neuroimaging Initiative (ADNI) to perform pseudo-longitudinal analysis of the continuum from preclinical to mild AD dementia, with the groups were further divided according to amyloid status based on PET. The patterns of atrophy in the MTL subregions largely recapitulated Braak staging of neurofibrillary tangles (NFT) within the MTL. Particularly, Brodmann Area 35 (the first region associated with NFT deposition), was the only region to discriminate preclinical AD from amyloid negative CN adults (“normal aging”). These findings suggest that subregional measures derived automatically from high-resolution MRI scans with ASHS may be a valuable biomarker for therapeutic trials in AD and related neurodegenerative disorders.
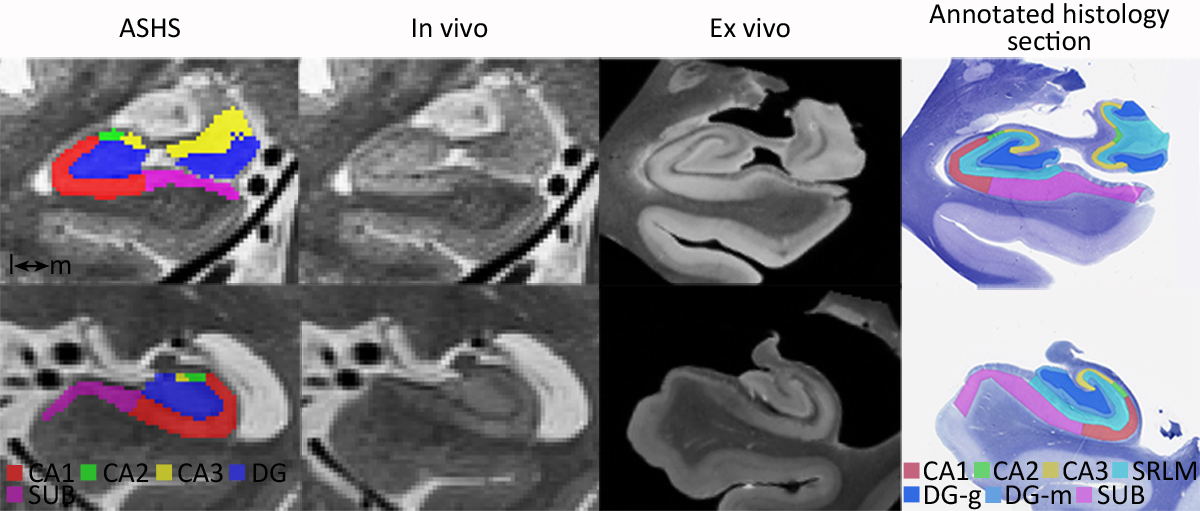
First comparison of in vivo/ ex vivo MRI scans of the human hippocampus
In our recent publication in Cerebral Cortex we compared in vivo and ex vivo MRI scans of the human hippocampus and evaluated to ability to match information between the two modalities. We were able to validate several of the features used for manual subfield segmentation on in vivo MRI scans with ex vivo MRI, and showed subvoxel accuracy of the Automated Segmentation of Hippocampal Subfields (ASHS) of the stratum radiatum lacunosum moleculare (SRLM). Additionally, we were able to perform a preliminary evaluation of ASHS against histology-based segmentations in two subjects.
Important milestone for the Penn ex vivo atlas of the human hippocampus formation
Daniel Adler’s MICCAI 2016 paper “Probabilistic atlas of the human hippocampus combining ex vivo MRI and histology” describes substantial progress on building a comprehensive atlas of the human hippocampus that combines ultra-high resolution ex vivo MRI and serial histological imaging. Scans from 26 ex vivo hippocampal specimens are combined into a probabilistic atlas/template using a custom registration strategy that combines surface and volume registration. Stacks of serial Nissl-stained histological sections are co-registered with the MRI and mapped into the atlas space. The atlas offers arguably the most comprehensive description of the inter-subject variability in the anatomy of hippocampal subfields. PICSL researchers are working on incorporating this atlas as a prior for automatic segmentation of hippocampal subfields in in vivo MRI scans. The atlas is also being leveraged by the international effort to harmonize the protocol for in vivo labeling of hippocampal subfields.
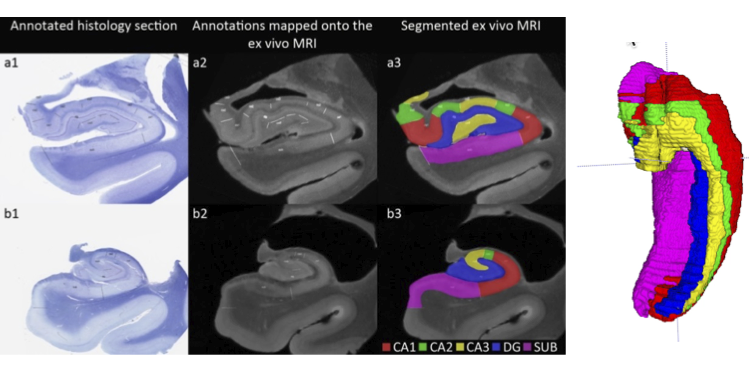
Labeling of hippocampal subfields in an ex vivo MRI scan on the basis of micro-anatomical features derived from histology. Boundaries drawn in histology space are mapped into the MRI space after histology-MRI registration, and volumetric labeling of hippocampal subfields is performed in MRI space.
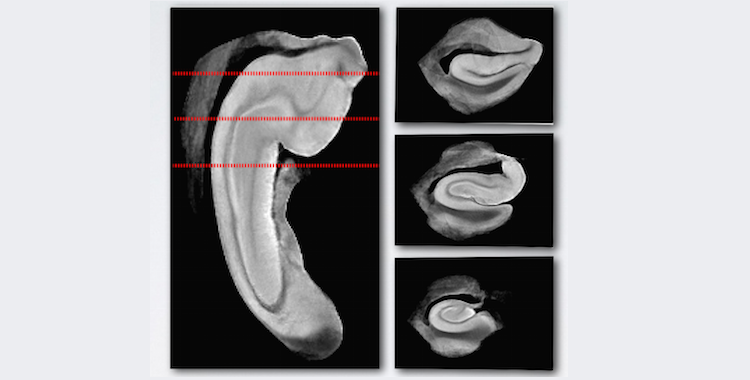
A template generated by volumetric registration of 26 ex vivo MRI scans guided by surface correspondences.
Psychometric Tests Predict ABeta in Mild Cognitive Impairment
Our paper showing that psychometric tests predict Alzheimer’s Disease pathology in Mild Cognitive Impairment subjects was just accepted by the Journal of Alzheimer’s Disease. Read the in-press version here.
Multi-Modal Dimensionality Reduction
Our paper on multi-modal dimensionality reduction was recently accepted by Methods. It shows how to use our sparse dimensionality reduction techniques to form interpretable predictive models from neuroimaging data. All data and code are open-source. Paper is available here.